Vizzlo Introduces Live Charts to Bring Up-to-Date Visualizations Into More Tools
Embed Vizzlo charts in tools like Notion, Miro, Confluence, Canva, and WordPress — and keep them automatically up to
Press Release Disclaimer: This is a press release distributed through the XPR Media network. It has not been independently verified by our newsroom.
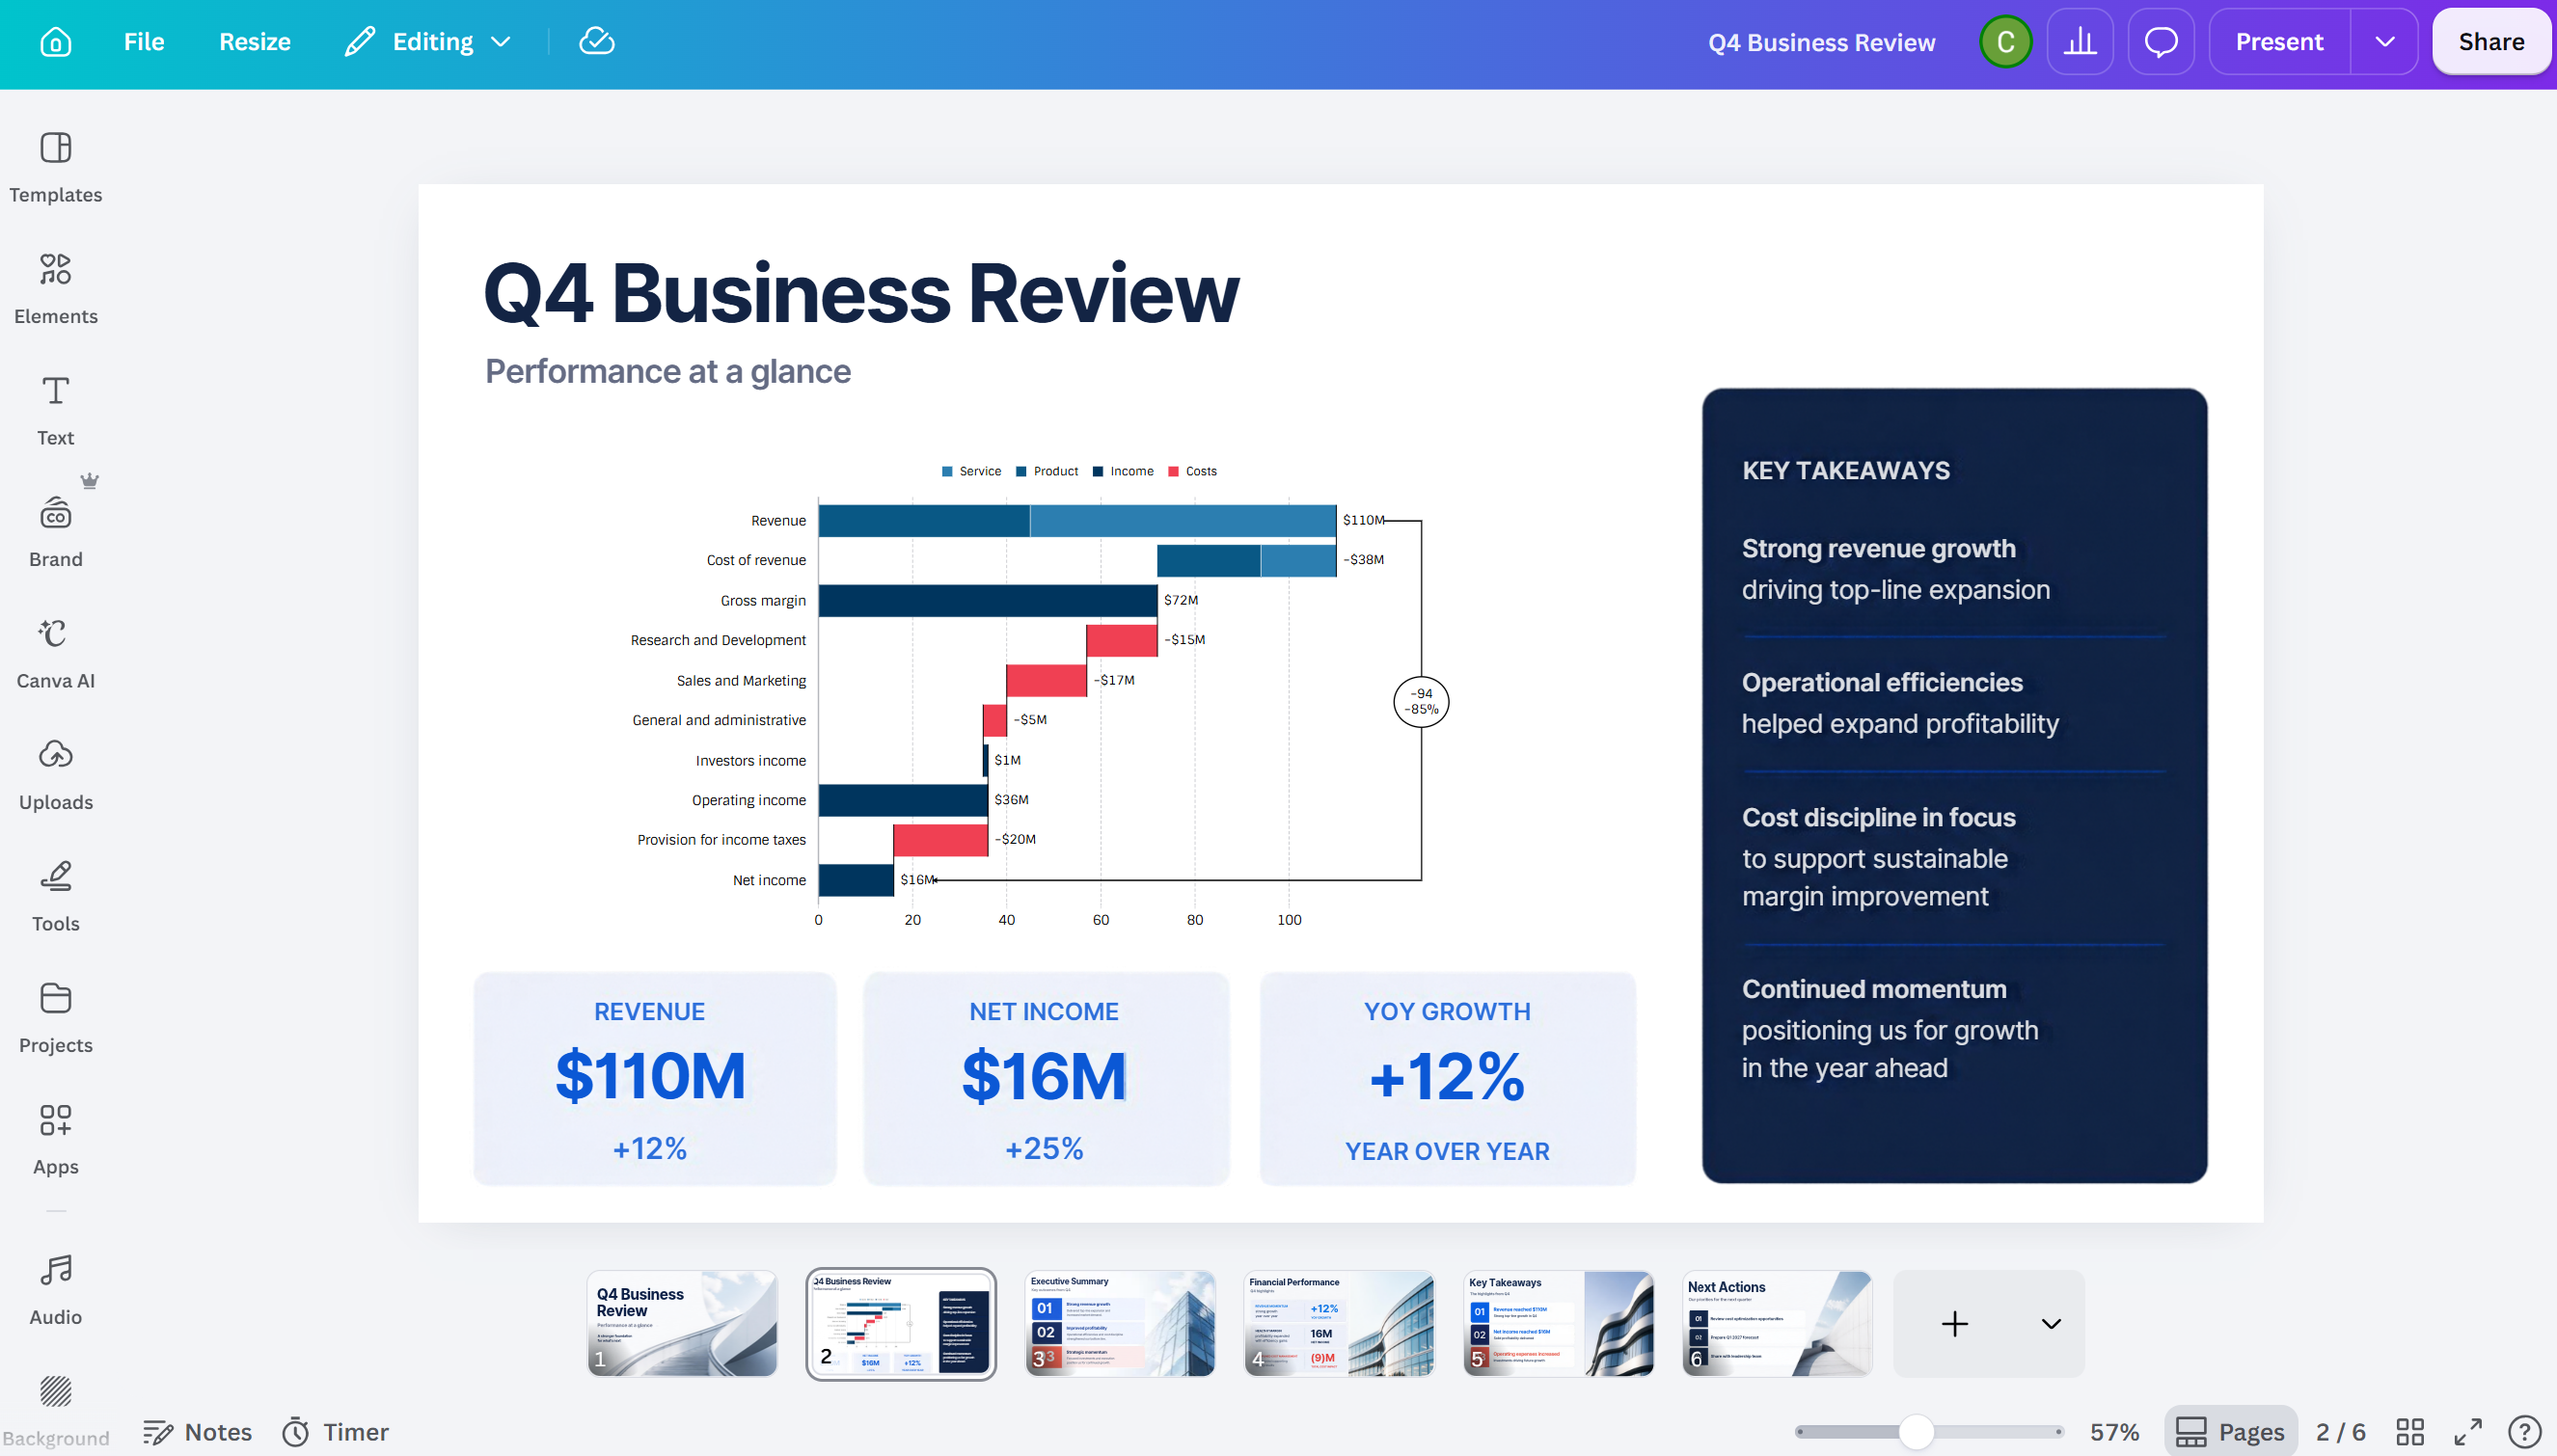

Embed Vizzlo charts in tools like Notion, Miro, Confluence, Canva, and WordPress — and keep them automatically up to date.
LEIPZIG, GERMANY, November 16, 2026 /EINPresswire.com/ — Vizzlo, the data visualization platform for creating professional charts in PowerPoint, Google Slides, and the web, today announced Live Charts, a new way to bring Vizzlo visualizations directly into the tools teams already use.
With Live Charts, users can embed Vizzlo charts in supported platforms including Notion, Miro, Confluence, Canva, and WordPress, while keeping them connected to the original chart in Vizzlo. Through support for the oEmbed protocol, Live Charts can also be used in other compatible platforms.
When the original chart is updated, every embedded version reflects the changes automatically, removing the need to repeatedly export images, replace screenshots, or manage multiple versions of the same visualization.
If a chart is connected to an external data source, such as Google Drive or Dropbox, it can also refresh according to the update schedule configured in Vizzlo.
“Presentations are only one part of how teams communicate with data,” said Robert Lillack, CEO at Vizzlo. “Live Charts make it easier to bring the same visualization into the rest of the workflow while keeping it connected and up to date.”
Bringing Charts Beyond Presentations
Charts appear across project documentation, collaborative workspaces, internal reports, design files, and published content.
Traditionally, moving a visualization between these environments has often meant exporting a static image. When the underlying data changes, each copy then needs to be replaced manually.
Live Charts provide a more connected alternative. Users can share a chart across multiple platforms and continue updating it from Vizzlo, with changes reflected automatically wherever it is embedded.
The capability complements Vizzlo’s existing integrations with Microsoft PowerPoint and Google Slides, extending the platform beyond presentations and into a broader range of team workflows.
More Than a Static Screenshot
Live Charts retain key elements of the viewing experience.
Viewers can zoom in to inspect details, while charts that include animation preserve that animation in the embedded version.
Chart creation and editing remain in Vizzlo, while the embedded versions provide an interactive viewing experience.
Simple to Use
Live Charts work through a simple copy-and-paste workflow.
Users open Export & Share, copy the chart’s sharing link, and paste it into a supported platform such as Notion, Miro, Confluence, Canva, or WordPress.
The chart appears directly in the destination and remains connected to Vizzlo, so future updates are reflected automatically.
Availability
Live Charts is available to all Vizzlo users.
For more information about Live Charts and how to use it, visit vizzlo.com/live-charts.
About Vizzlo
Vizzlo helps teams turn data into professional, presentation-ready visualizations. With a broad library of chart types and integrations for PowerPoint, Google Slides, and the web, Vizzlo enables users to create, customize, and share charts across their workflows.
Camilo Rada
Vizzlo GmbH
Visit us on social media:
LinkedIn
Legal Disclaimer:
EIN Presswire provides this news content “as is” without warranty of any kind. We do not accept any responsibility or liability
for the accuracy, content, images, videos, licenses, completeness, legality, or reliability of the information contained in this
article. If you have any complaints or copyright issues related to this article, kindly contact the author above.

Media gallery